Spend Less Time on Paperwork. More Time Improving your Quality.
We build digital tools that help laboratories simplify documentation, monitor quality control, and manage everyday quality work with greater confidence.
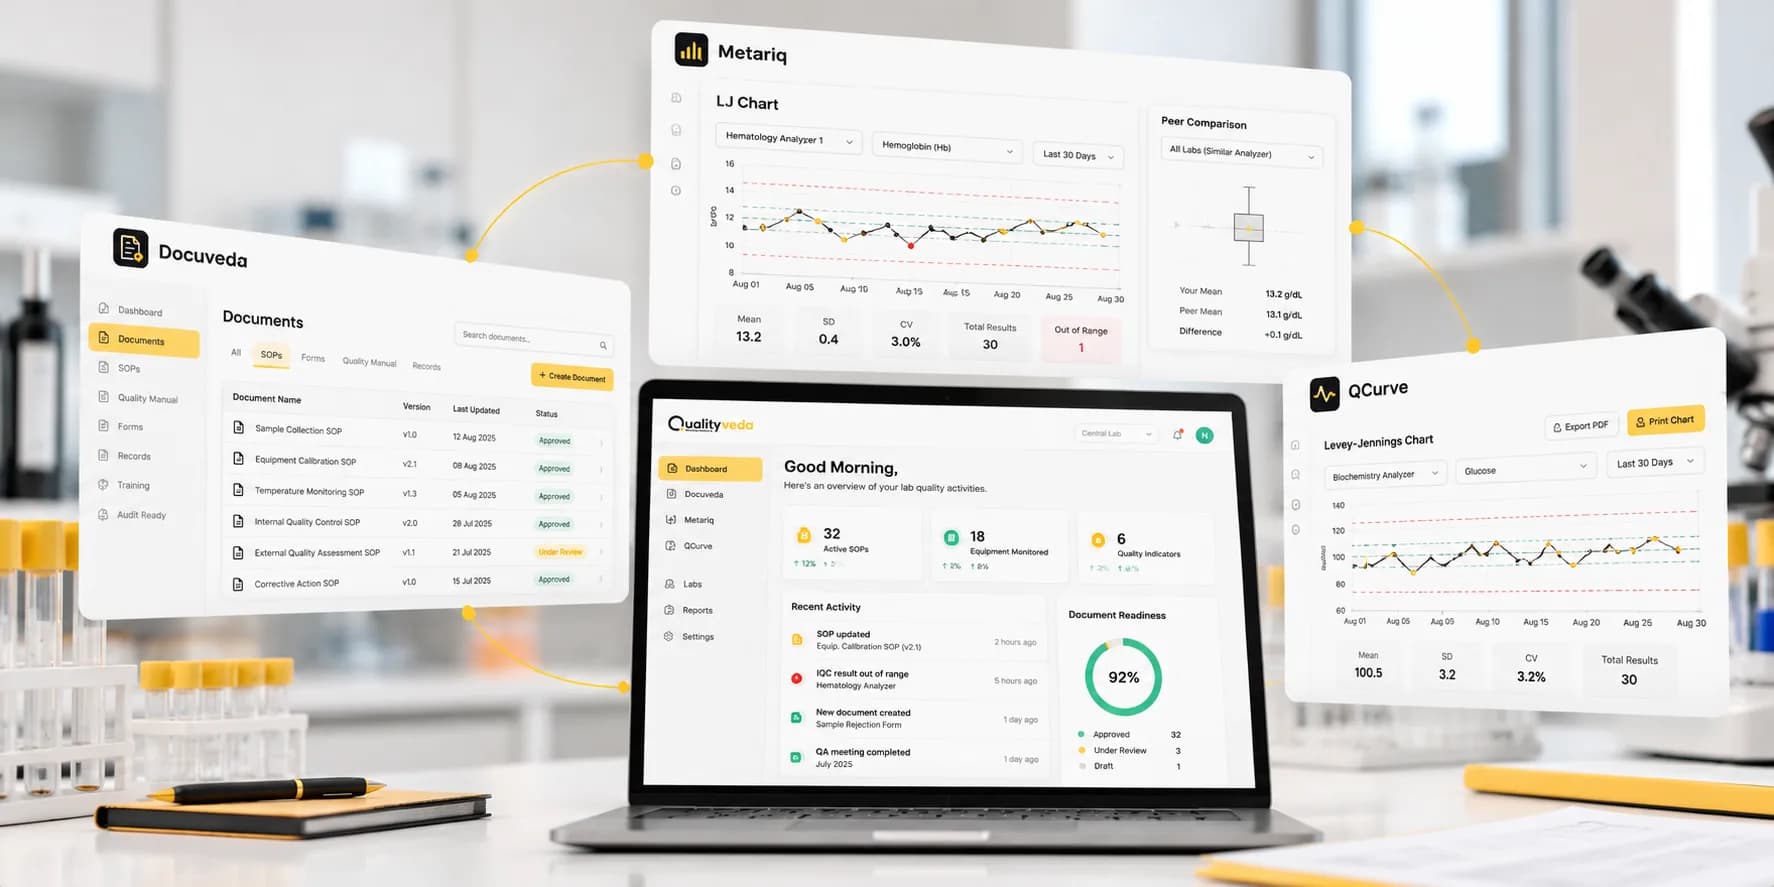
Less manual work. Better control over quality.
Quality work should not depend on scattered spreadsheets, repeated paperwork, or disconnected processes. We are building digital tools to help your team to manage quality work more efficiently.

AI-powered laboratory documentation
Reduce paperwork. Save time and manpower.
Automate record keeping, SOP creation and quality indicator monitoring. Make standard compliant SOPs in one day, keep your records organized, and make them easy to access and presentable.
Key benefit: Reduce manual work and manpower costs by up to 20%.

Free LJ chart tool
Better QC charts. No extra cost.
Create and print clear LJ charts, record QC results for as long as you need, and establish your lab mean. Get more flexibility and clearer chart presentation than the basic LJ charts generated by your equipment.
Key benefit: A free, easy-to-use tool for everyday QC work.
Smart laboratory QC monitoring
Your lab's QC performance, right on your phone.
View LJ charts across your lab equipment from one place. Monitor quality control performance and compare your lab's results with peer laboratories in real time.
Key benefit: Monitor QC performance from anywhere and improve reporting quality.
What each product includes
Each product takes one part of everyday quality work off your team's hands: documents and records, daily quality control, and QC monitoring across your analyzers.
Docuveda is AI-powered laboratory documentation software for NABL accreditation and ISO 15189:2022 compliance. It helps your quality manager create standard-compliant SOPs in one day, instead of writing every document from scratch, and keeps your whole document control system in one place.
Every document sits in a four-level document hierarchy, records stay organised and easy to present during an assessment, and quality indicators are monitored beside your documents. Role-based access and audit trails control who sees what, and a live dashboard brings analytics and reports together, reducing manual work and manpower costs by up to 20%.
Who it is for
Medical laboratories putting ISO 15189 and NABL documentation in place, and keeping it up to date without the paperwork.
- Standard-compliant SOPs, made in one day
- Records kept organised, easy to access and presentable
- Quality indicator monitoring in the same place as your documents
- A four-level document hierarchy, so every document has its place
- Role-based access and audit trails, so each person sees what their role needs
- A live dashboard with analytics and reports
QCurve is free quality control software for Windows that turns your laboratory's daily internal QC values into Levey-Jennings (LJ) charts. Enter control values for each analyte, and QCurve checks every value against the Westgard rules and flags violations at once.
Each LJ chart shows the mean, SD and CV%, ready to print, and your lab can establish its own mean from its QC results. QC records and a violation log are kept for as long as you need them, ready for NABL assessors. QCurve runs offline on Windows 10 and 11 (64-bit), with no subscription, so your QC data stays on your own computer.
Who it is for
Laboratories that plot LJ charts by hand or in spreadsheets, including those running manual and semi-automated analyzers such as electrolyte, coagulation, urine and semi-automated biochemistry analyzers.
- Daily control values entered for each analyte
- Every value checked against the Westgard rules, with violations flagged at once
- Levey-Jennings charts with mean, SD and CV%, ready to print
- Your lab's own mean, established from your QC results
- QC records kept for as long as you need, with a violation log for assessors
- Runs on Windows 10 and 11 (64-bit), offline, with your data on your own computer
Metariq is smart laboratory QC monitoring software, now under development. It will bring Levey-Jennings charts from across your lab equipment into one place, with quality control monitored straight from your analyzers.
Quality managers and laboratory heads will be able to follow QC performance on their phone from anywhere, and compare their laboratory's results with peer laboratories in real time, to improve reporting quality.
Who it is for
Laboratories running quality control on several analyzers that want one view of their QC performance, wherever they are.
- LJ charts from across your lab equipment, in one place
- QC monitored straight from your analyzers
- One view of QC performance across all your analyzers
- QC performance on your phone, from anywhere
- Your results compared with peer laboratories in real time
- Better reporting quality, with QC performance always in view
How the products fit with our services
Our software covers the parts of quality work that repeat every day. Documents and records are Docuveda's job; daily internal quality control is QCurve's, and soon Metariq's.
The calculations for method validation studies (precision, linearity and carryover) are on our free Tools page, each with a PDF report. Learning ISO 15189:2022 is the work of our training course, and getting your laboratory or hospital accredited is the work of our consultancy team.
Products: common questions
Is QCurve really free?
Yes. QCurve is free quality control software with no subscription. To download it, fill in a short form with your name, email, phone number and organisation. We email you a 6-digit verification code; once you enter it, the download starts and the download links are sent to your email as well.
What do I need to run QCurve?
A computer with Windows 10 or 11 (64-bit). QCurve runs on your own computer and works offline, with no internet needed. A macOS version is coming soon.
What is a Levey-Jennings chart?
A chart of a control material's results plotted day by day around its mean, with lines at one, two and three standard deviations either side. Drifts, shifts and sudden outliers that are hard to see in a column of numbers stand out at once, which is why it is the everyday picture of a test's internal quality control.
What are the Westgard rules?
A set of rules for deciding whether a quality control run can be accepted. Each rule looks for a pattern, such as one result beyond three standard deviations, two in a row beyond two on the same side, or a long run of results all on one side of the mean. Together they catch both random error and systematic error while keeping false rejections low.
Where is QCurve's data stored?
On your own computer. Your QC values and charts stay with you, which is also why QCurve works without an internet connection.
Does QCurve help with NABL and ISO 15189?
NABL-accredited laboratories are expected to keep internal quality control records and show they monitor analytical performance. QCurve keeps those records, checks each value against the Westgard rules and exports Levey-Jennings charts with mean, SD, CV% and a violation log, ready for assessors.
What does Docuveda do for a laboratory?
Docuveda is AI-powered documentation software for medical laboratories working to ISO 15189. It helps you create standard-compliant SOPs, keep records organised in a four-level document hierarchy, monitor quality indicators and control who can see each document. Find out more at docuveda.com.
When will Metariq be available?
Metariq is under development. When it is ready it will show your lab's LJ charts from across your equipment in one place, on your phone, with comparison against peer laboratories. It will be listed here as soon as it is available.
Do we need these products to get accredited?
No. NABL, NABH and CAP assess your quality system, your records and your people, not the software you use. The products save your team time on documents and quality control.
Where are the method validation calculators?
On our Tools page: free calculators for precision, linearity and carryover studies, each with a PDF report, and a NABL logo generator that sets your certificate number under the accreditation symbol.
